The Weekly Report identifies the activity for each week within the report
time frame. Remember that one page hit can result in several server requests
as the images for each page are loaded.
Note: Depending on the
report time frame for this report the first and last week may not represent
a full seven day week, resulting in lower hits.
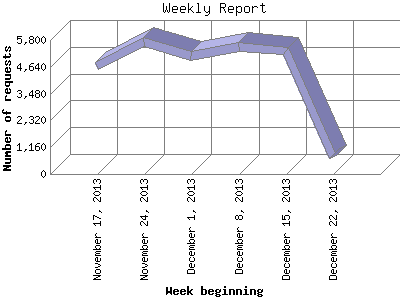
| Week beginning | Number of requests | Number of page requests | Number of bytes transferred | |
|---|---|---|---|---|
| 1. | November 17, 2013 | 4,686 | 4,383 | 80.679 MB |
| 2. | November 24, 2013 | 5,719 | 5,015 | 83.787 MB |
| 3. | December 1, 2013 | 5,105 | 4,205 | 86.100 MB |
| 4. | December 8, 2013 | 5,489 | 4,205 | 85.775 MB |
| 5. | December 15, 2013 | 5,314 | 4,292 | 86.174 MB |
| 6. | December 22, 2013 | 741 | 657 | 12.608 MB |
Most active week beginning November 24, 2013 : 5,015 pages sent. 87,856,854.00 served. 5,719 requests handled.
Weekly average: 3,792 pages sent. 72.520 MB served. 4,509 requests handled.
This report was generated on December 23, 2013 01:06.
Report time frame November 20, 2013 23:01 to December 23, 2013 00:04.
| Web statistics report produced by: | |
 Analog 6.0 Analog 6.0 |  Report Magic 2.21 Report Magic 2.21 |